Table of Contents
Report about testing of 64,000 connections online
At previous article we examined the how to conduct the stress testing. And here I want to show you how I conducted it by myself, and give its results.
Results
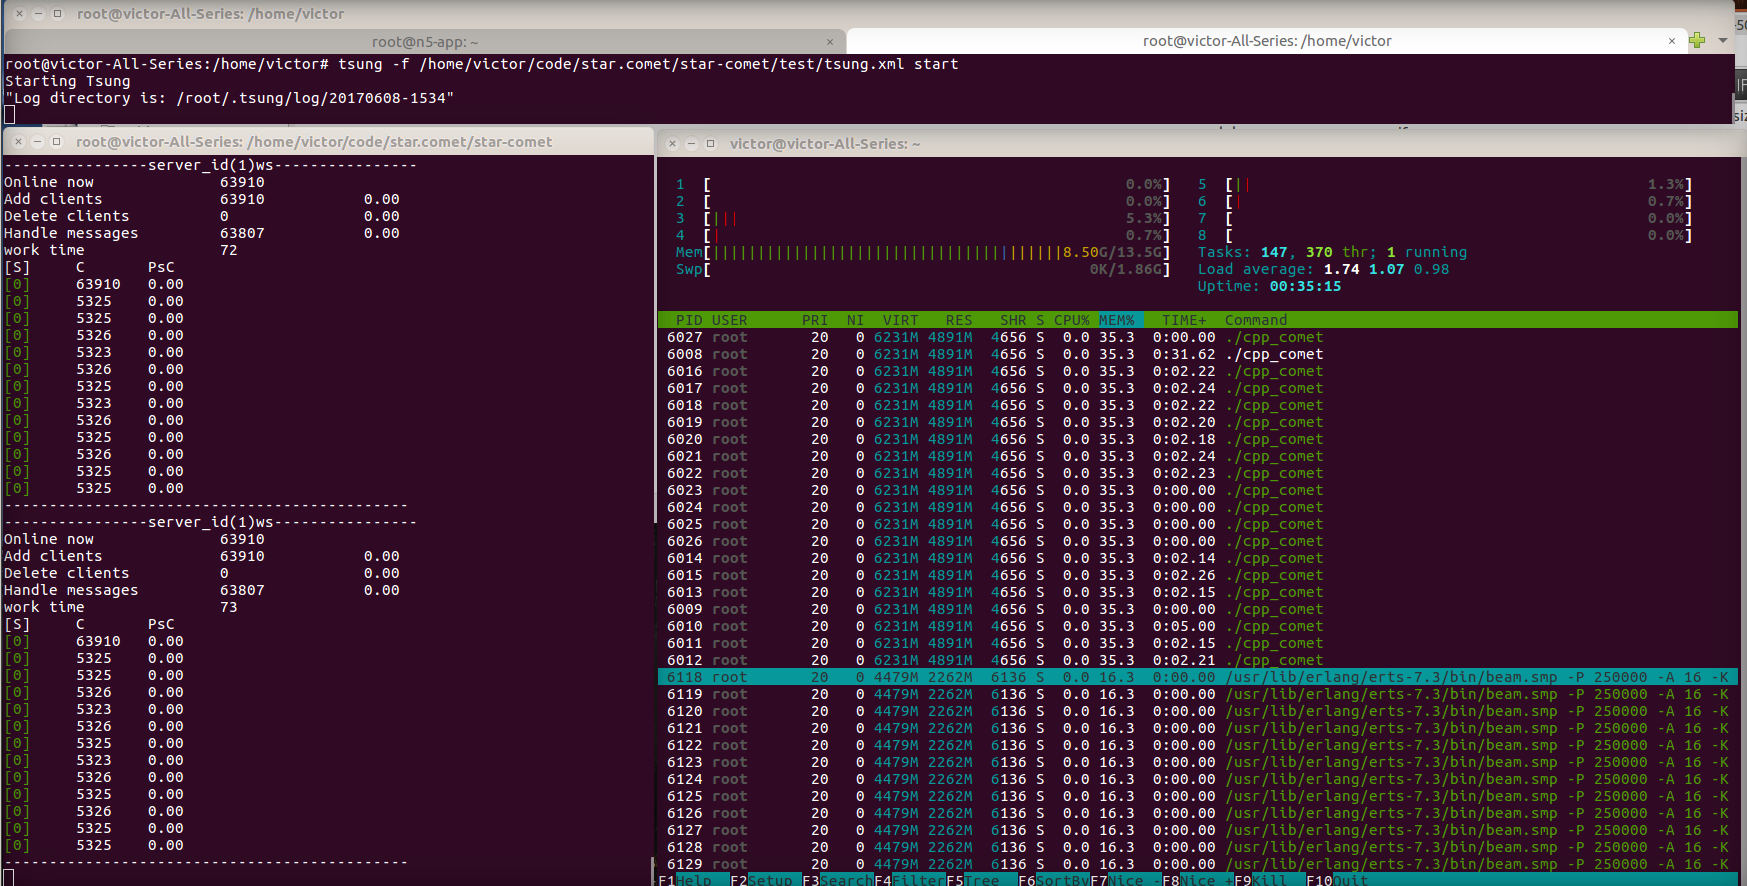
On the screenshot you can see 3 consoles.

- At the top was running the tsung
- At the left is the comet server
- At the right - htop
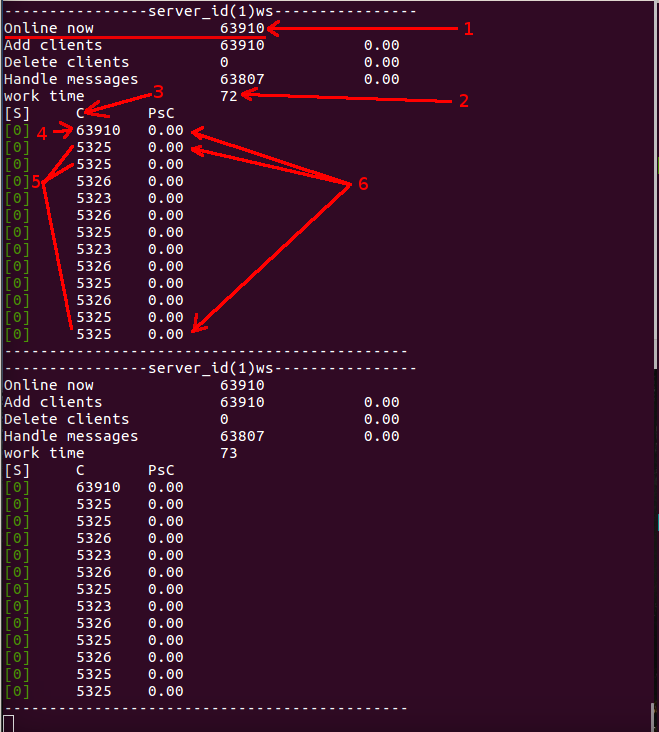
The output of the comet server
The numbers are on the screenshot:
Number of connections online; Server’s operating time in seconds; A column with a list with amount of network events was processed for the entire time (such as connecting, receiving messages, closing the connection); The first process in the list was processed most of all as it was engaged in receiving incoming connections (under a normal load, there is not such a large separation because the incoming connection is set for a long time); Other processes for already received connections processed incoming messages; The PcS column indicates how many network events were processed in the last second (there are no zeros on the gif animation) Zero since the connections are accepted and hang in anticipation of incoming messages, but with this test scenario we do not send any additional events.
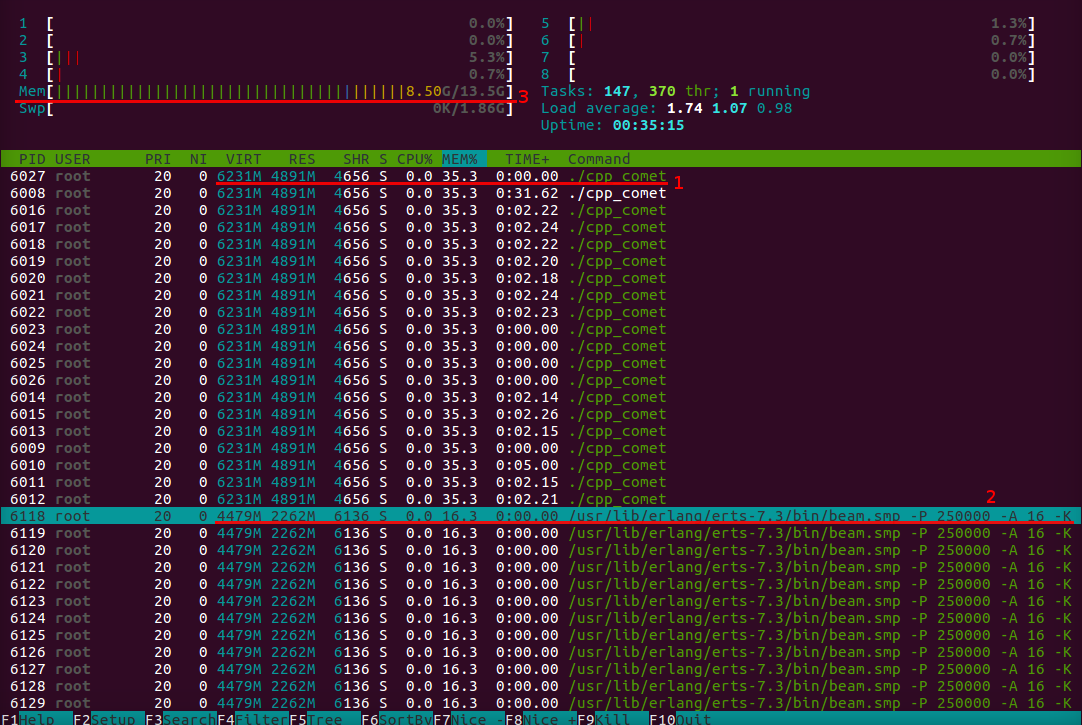
The output of htop
The numbers are on the screenshot:
Comet server processes (It can be seen that he spent 4891 MB of RAM); tsung processes (It can be seen that he spent 2262 MB of RAM); Total memory consumption (The rest was consumed by the operating system and other programs started at the time of testing).
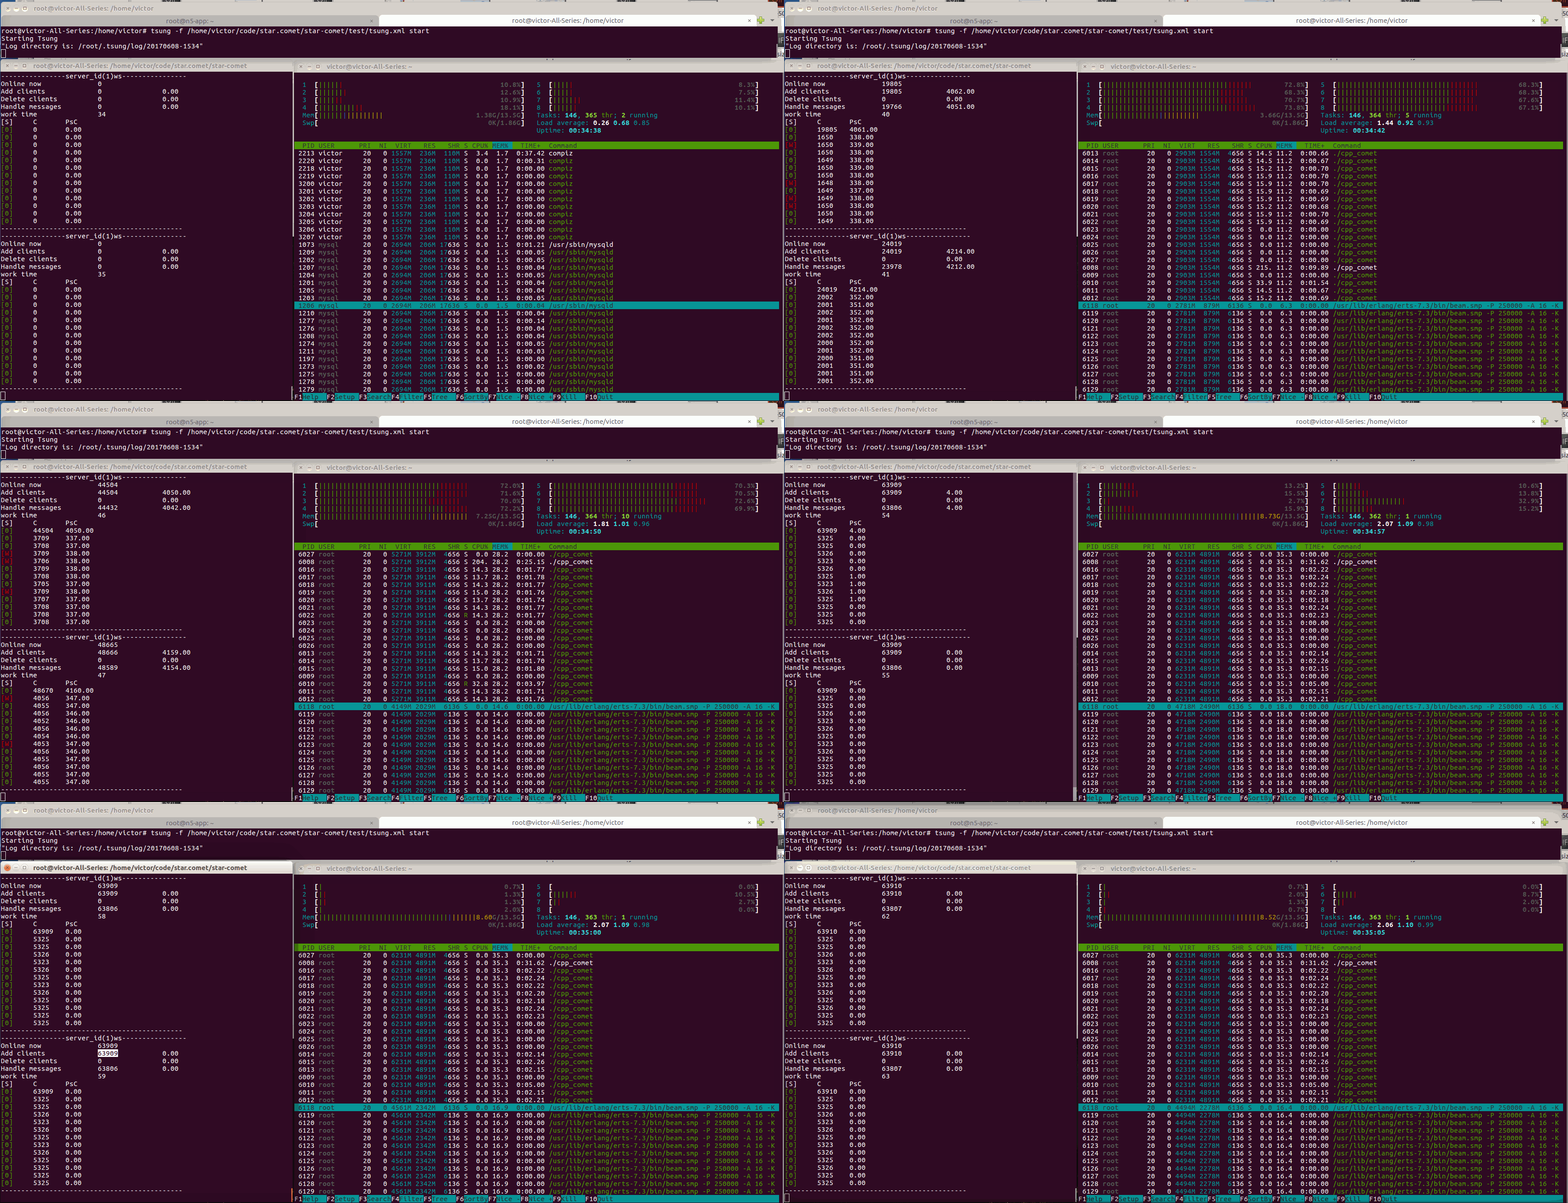
The testing process
Gif-animation of the testing process. It is seen that there is an increase of about 2,500 connections per second and that all the kernels are loaded almost evenly. You can also see an increase in memory consumption.
The tsung report
Queries per second
The number of simultaneous connections


Discussion